How much battery life does NTN actually drain?
How much battery life does NTN actually drain?
In the previous article we put a number on the energy cost of talking to a satellite instead of a ground station. It turns out that Skylo/GEO NTN registration uses roughly 13× more energy than terrestrial, and a transmission of a 28-byte payload roughly 14× more — once the UART overhead is compensated out. Those ratios are real, and at first glance they look like a verdict… Skylo/GEO NTN battery life is a no-go.
But that’s not the whole story. A per-transmission ratio doesn’t tell you how long a device will last in real-world use. Duty cycle does. So this article picks up exactly where the energy measurement left off and answers the next big question: given those numbers, what battery do you choose, and how long does the device actually run?
This is the fourth article in our series on power consumption with the Nordic nRF9151. The earlier three covered LTE power save modes (PSM and eDRX) and the per-event energy cost of NTN versus terrestrial connectivity. If you want the full measurement setup and the waveforms behind the energy figures, start there:
- Measuring LTE Power Save Modes on Nordic nRF9151-DK
- Performance of LTE Power Save Modes on Nordic’s nRF9151-DK
- How much does NTN connectivity for IoT cost in energy?
From energy per event to battery life
We measured the per-event energy cost on two identical nRF9151-SMA-DK boards. Same firmware, same PSM configuration, the only difference being the connectivity mode. For the measurement, we used an Otii Ace Pro on each board.
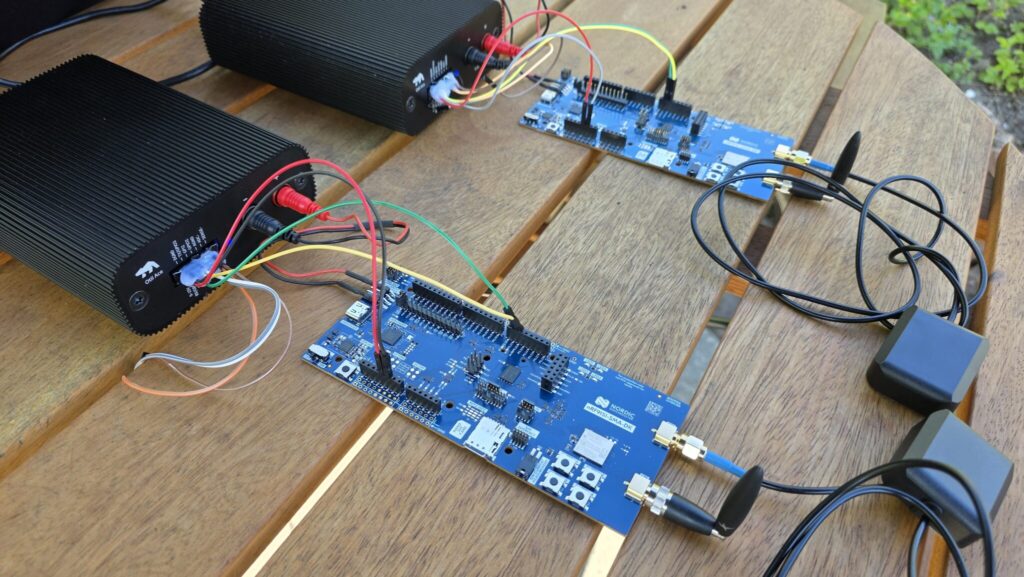
The full setup, including why we had to run the test outdoors with a clear view of the southern sky, is in the previous article.
Here are the compensated per-event costs, with the UART overhead removed:
| Phase | Terrestrial | Skylo/GEO NTN (Satellite) | Ratio |
|---|---|---|---|
| GNSS fix | — (not required) | ~1.40 mWh | — |
| Network registration | ~213 µWh | ~2.85 mWh | ~13× |
| Data transmission (28 bytes) | ~163 µWh | ~2.35 mWh | ~14× |
Energy per event is the input. Battery life is the output. To calculate this, you also need to define how often the device sends data and use a pre-created or imported battery profile measured under that load and the deployment conditions. That is what the Otii Battery Life Estimator does. It takes the measured current profile of the device’s activity and the measured battery profile to estimate how long the device will run and the total battery capacity used.
The estimation workflow has three steps:
- Define the device profile
- Define the battery profile
- Run the estimate
Let’s look at each step.
Device profile
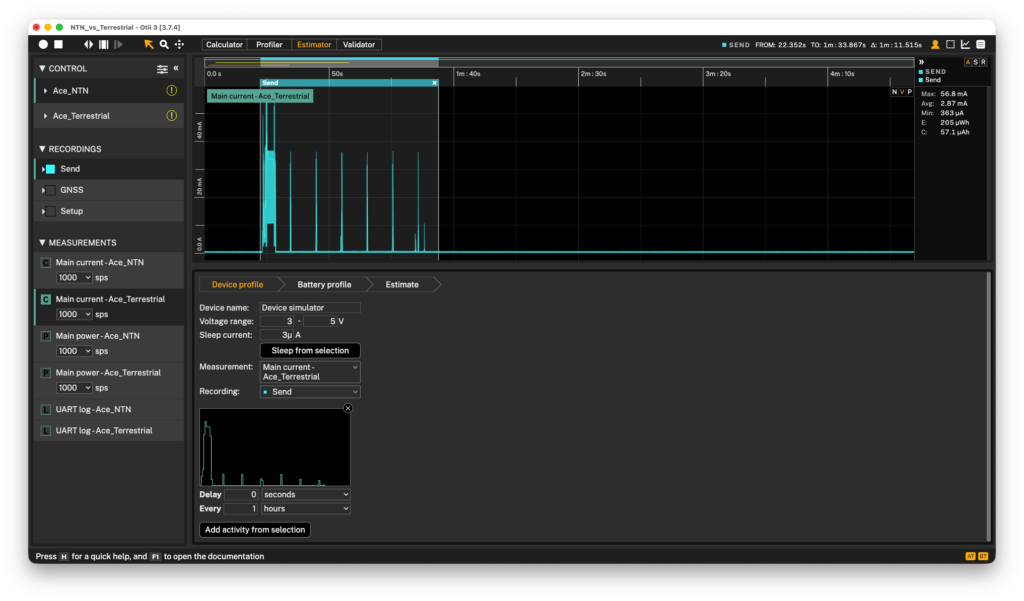
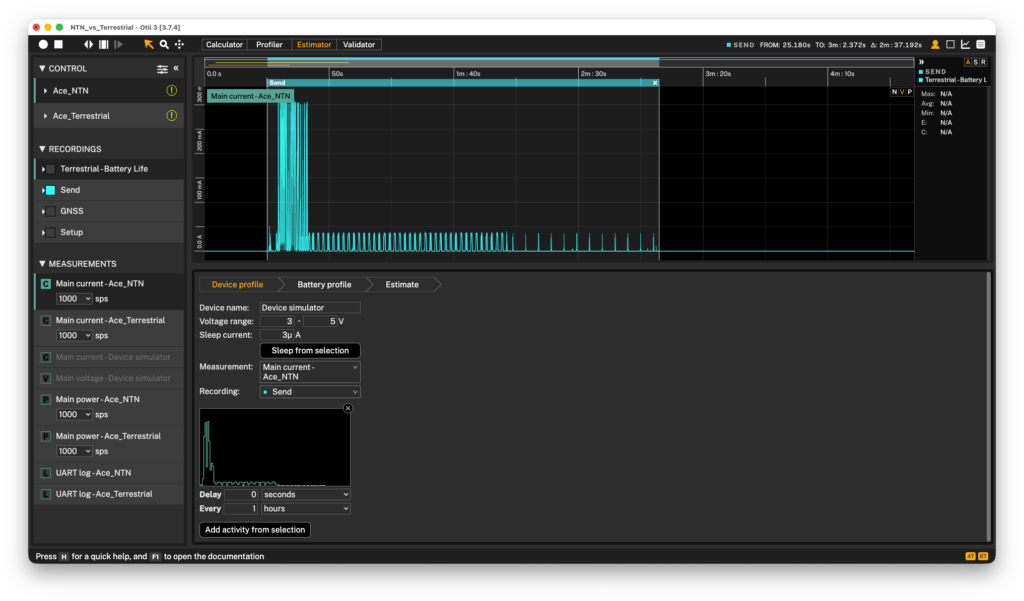
The device profile defines how the measured activity should be interpreted in the battery-life estimate. This includes the operating voltage range, the average sleep current, the recording to use, and the activities that make up the duty cycle.
In this example, the voltage range is set to 3–5 V. This reflects the usable voltage window of the device: the nRF9151 browns out below 3 V, so the estimate should stop there rather than at the battery’s nominal end-of-life voltage.
The sleep current is set to 3 µA. During the automated test, the measured sleep current was around 600 µA, but this was caused by the serial-modem application keeping the UART block active. In a real product, the application runs on the modem without UART active, so the expected sleep current is closer to 3 µA. Using the measured 600 µA value would produce an unrealistic battery-life estimate. *See the previous article for more details.*
Lastly, in this step, we will define the transmission activity by selecting it directly from the recording, using this as the baseline for the terrestrial-based setup. Starting with a transmission once every hour.
Battery profile
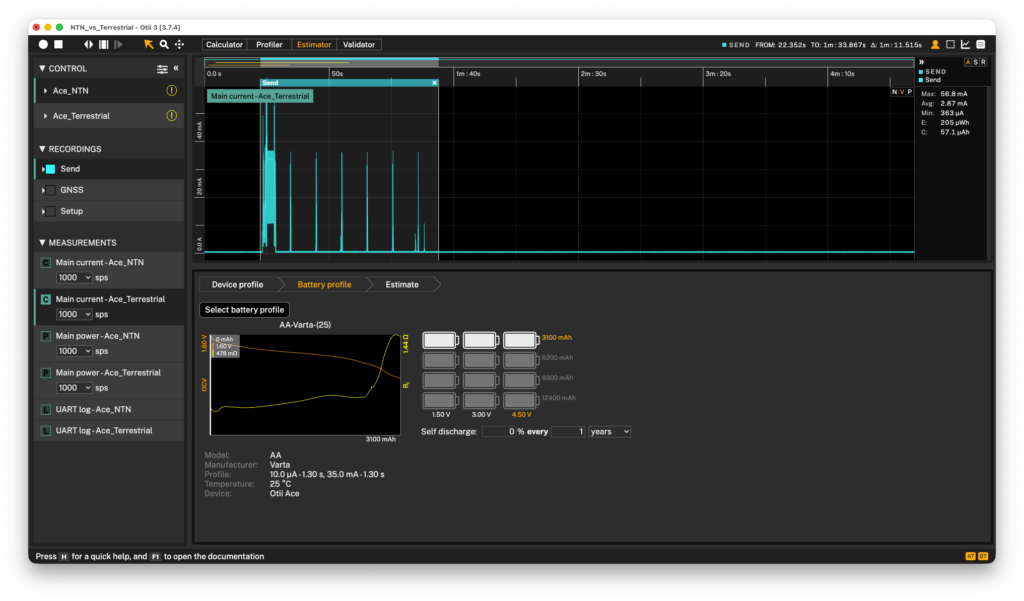
In the battery profile step, you can choose a profile from your library, configure the battery pack, and, if needed, adjust the battery’s self-discharge rate. Here, we are using Varta AA battery profiled at 25 C, with a 3S1P configuration as battery pack.
Battery life estimation
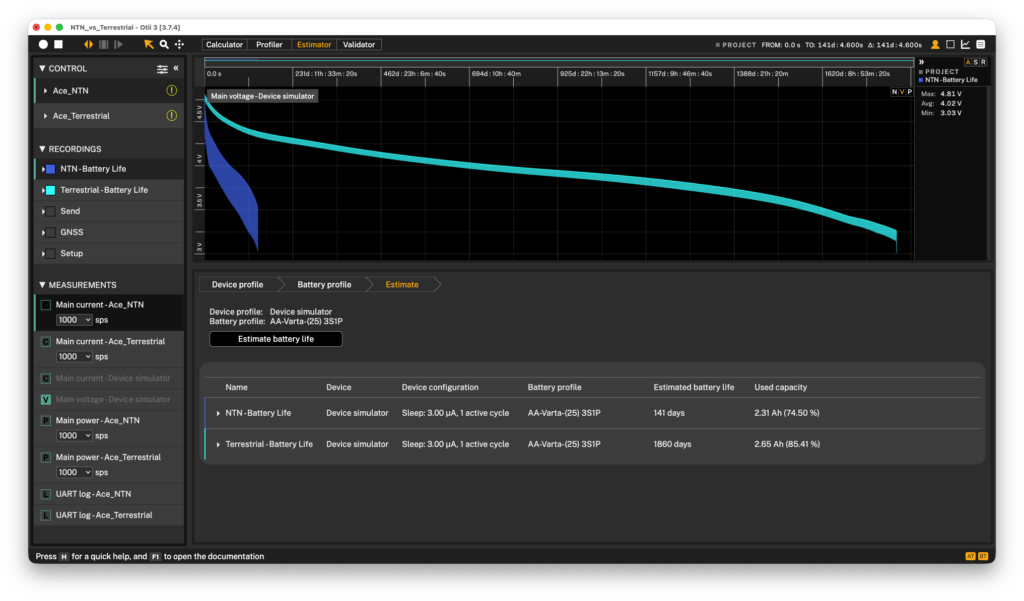
To complete the last step, simply click on the “Estimate Battery Life” button, and in just a couple of seconds, the estimated battery life, capacity used, and a graph showing the battery voltage over time will be displayed.
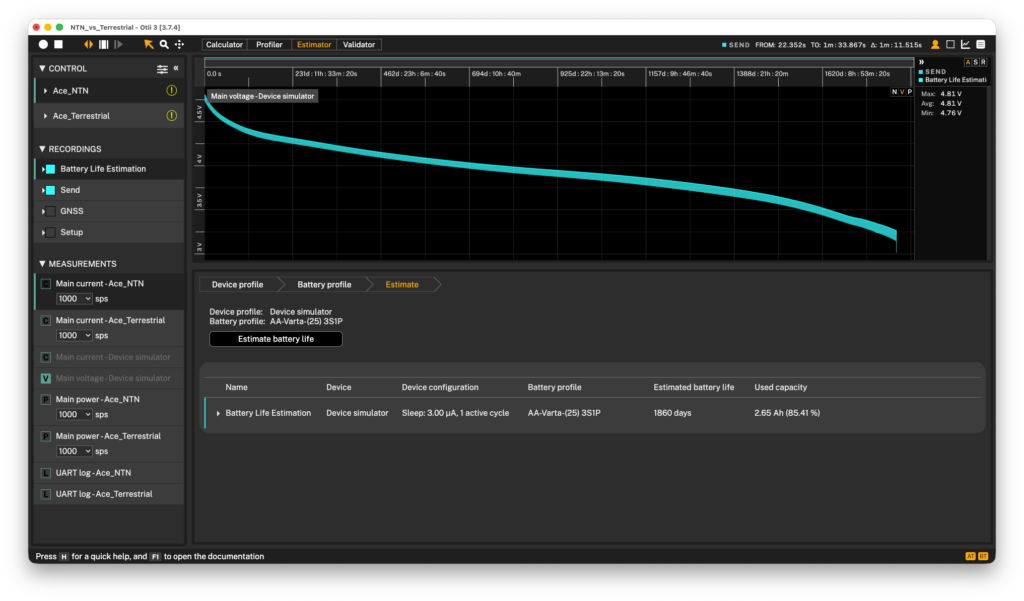
We’ll unpack what the results mean in the next section — for now, the goal is just to generate every figure so the comparison is straightforward.
Returning to the device profile step, we’ll change the activity to hourly transmission, this time for NTN.
Now, moving on to the estimate step again, we recalculate. The new result is listed above the previously estimated terrestrial value, which makes comparing the two setups easy.
The numbers
The estimate covers the recurring transmission activity every hour. For a real deployment, you might need to add the per-wake registration cost and, on the NTN path, the GNSS fix — both of which depend on whether the device is stationary and can reuse a fix, so they belong in your own activity profile rather than baked into a headline number.
| Estimated battery life (3S1P AA) | Terrestrial | Skylo/GEO NTN (Satellite) |
|---|---|---|
| 1 transmission per hour | 1860 days (~5 years) | 141 days (~4.6 months) |
At one transmission per hour, the difference is huge, 5 years versus about 4.6 months. But this isn’t a fair comparison. The device connects to a terrestrial base station that might be just a kilometer away, while the NTN board communicates with a satellite over the equator at a hight of 35,800. It’s like the difference between whispering and shouting. You only use the satellite when there is no terrestrial coverage, such as in the mountains, deep forests, or out at sea.
Duty cycle is the design variable, not the connectivity mode
NTN isn’t a direct replacement for terrestrial networks. You use it when nothing else works, like for a wildfire sensor deep in the forest, a buoy out at sea, or a pipeline monitor in the mountains. In these situations, you don’t send data every hour. Instead, you batch transmissions. For example, a livestock tracker doesn’t need to report “the cow is fine” sixty times an hour. It just sends a position and a health update twice a day and sleeps the rest of the time.
Estimating the NTN setup again with a more realistic duty cycle. As an example, let’s say two transmissions a day instead of one an hour, on the same battery pack. With this as a reference, it takes it from ~4.6 months to ~4.4 years.
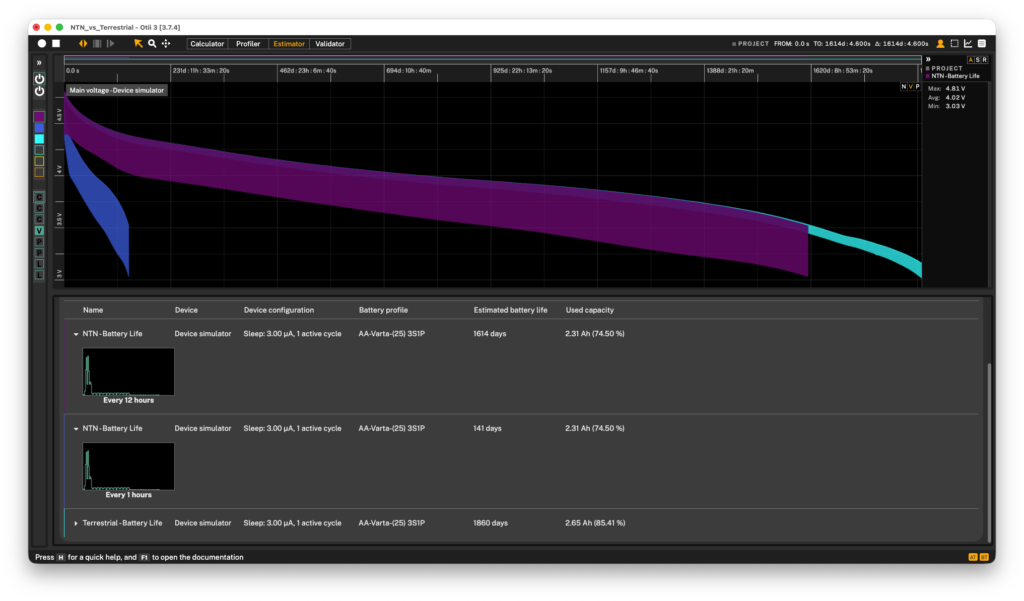
That’s what the per-event ratio doesn’t show. The 14-times higher cost per transmission is set by physics: a GEO satellite orbits about 35,800 km above the equator, so it takes far more power to reach than a base station down the road. You can’t change that. What you can control is how often you pay that cost. In an NTN device, battery life depends much more on duty cycle than on the cost of each event. Once you understand this, NTN isn’t a battery deal-breaker. Instead, it becomes a design constraint you plan for, just like any other.
There’s one thing you can’t avoid with duty cycle: peak current. NTN transmissions cause current spikes of several hundred milliamps. Even if you only transmit twice a day, the battery still needs to handle that spike when it happens, or the voltage will drop too low. Average power determines battery life, but peak current decides if your power source can handle the job. Both factors show up in your measurements.
The estimate is only as honest as its inputs
Here is the part that matters more than any single number above. The Estimator gave us 4.4 years because we fed it two measured things: the real current profile of this device doing this activity, and a battery profile built from the real discharge behaviour of the cells we intend to use.
Neither of those comes from a datasheet. A datasheet capacity figure is measured under a constant, gentle discharge that looks nothing like an NTN transmission’s current spikes, and real usable capacity can fall well short of the nominal number once your load profile diverges from the datasheet’s test conditions. If you build a battery-life estimate on a nominal mAh number and a nominal sleep current, you get a confident answer that the field will quietly contradict.
So the workflow that produces a number you can defend is: measure the device’s real activity, profile the actual battery under that load, and validate it for the environment the product will live in; temperature, antenna conditions, satellite elevation, and all the other conditions the product will face in the field. The 4.4-year figure here is true for our device, our cells, our test conditions. Yours will be different, and the only way to know your number is to measure your device.
Takeaway on NTN battery life
NTN’s energy penalty is real and it isn’t going away — but it’s a constraint you design around, not a wall. The per-transmission cost is set by physics; the battery life is set by your duty cycle, your peak-current handling, and the honesty of your inputs. Treat the 13–14× ratio as a reason to model carefully, not a reason to walk away.
And whatever you take from the numbers above, don’t take the numbers themselves to the bank. They describe our device on our bench in a garden in Lund. Build your estimate from your own measurements!
All measurements were made with the Otii Ace Pro. Boards: nRF9151-SMA-DK × 2. Modem firmware: mfw_nrf9151-ntn_1.0.0. Application firmware: nrf9151dk_serial_modem_v1.0.0.hex. Location: Lund, Sweden, outdoors with a clear southern sky view.
Watch the full webinar: The Non-Terrestrial Networks Sanity Check
We began this battery-life comparison with a live power analysis during The Non-Terrestrial Networks Sanity Check, hosted by the IoT Stars community. We used the Otii Ace Pro to measure the real energy cost of each phase for the nRF9151’s NTN path, all on camera. In the full session, we also discuss these numbers in relation to cost and link budget, with Monogoto, and Kyocera AVX, rounding out the stack.