AAA battery testing made easy with Otii Ace Pro and Otii Battery Toolbox
AAA battery testing made easy with Otii Ace Pro and Otii Battery Toolbox
Many engineers and developers working with IoT devices suspect that their products suffer from poor battery lifetime, but they don’t know how to begin addressing the problem. They view battery testing as complicated, time-consuming, and requiring expensive and extensive lab setups.
The truth is, while batteries can be complex, testing with Otii Ace Pro and the Otii Battery Toolbox is easy. You can create battery profiles, validate performance, and gain insights into how your devices behave under realistic conditions, without being a battery expert.
This article provides a practical example: testing five brands of AAA alkaline batteries under various discharge conditions, demonstrating how Otii simplifies the process.
What we tested
We selected five standard alkaline AAA batteries, each marketed as a premium option for high-drain devices:
- Duracell Optimum – Designed for demanding devices
- Energizer Max Plus – Premium alkaline with lower internal resistance and longer shelf life
- GP Ultra Plus – Optimized for high-drain use
- Panasonic Evolta – Longer-lasting alkaline compared to Panasonic’s standard line
- Varta Longlife Max Power – Precise and long-lasting
All batteries were discharged at 25°C in a temperature-controlled chamber (optional, but it removes environmental variations). They were not brand new, stored for 1–2 years, so some self-discharge had occurred. However, since all brands were treated equally, the comparison remains valid.
Why discharge methods matter
Most datasheets show only constant-current discharge curves, but IoT devices rarely consume power that way. Instead, they operate in bursts – active when sensing or transmitting, then sleeping in between.
To reflect this, we compared four discharge methods:
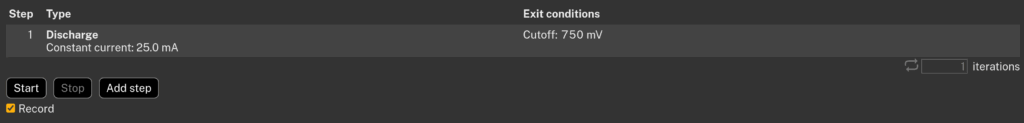
- Constant Current (25 mA) – The reference measurement
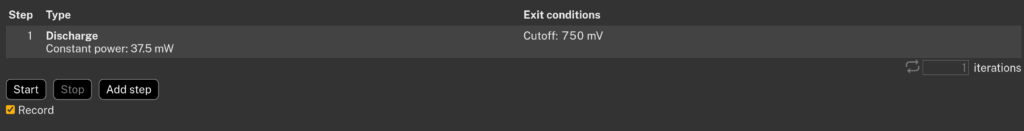
2. Constant Power (37.5 mW) – Equivalent to 25 mA at 1.5 V, but current increases as voltage drops
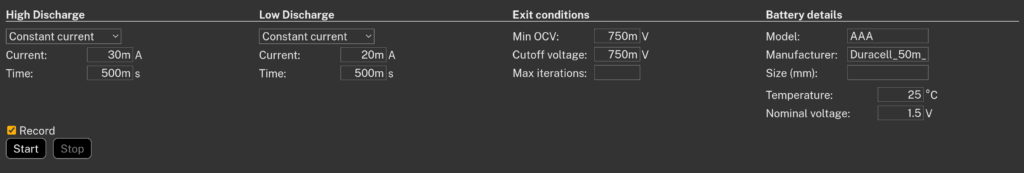
3. Pulsed 1 (30 mA / 20 mA alternating every 0.5s) – Average 25 mA, simulating moderate activity variation
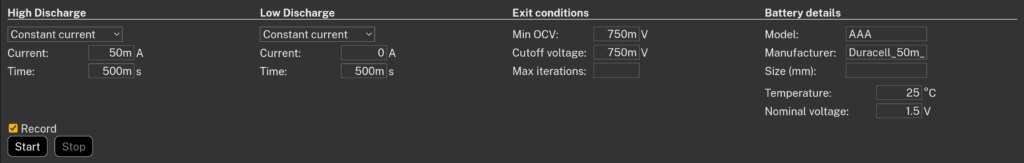
4. Pulsed 2 (50 mA for 0.5s / 0 mA for 0.5s) – Average 25 mA, simulating active/sleep cycles
For each brand and method, two batteries were tested. If one was clearly faulty, it was excluded from the evaluation.
The Otii battery testing setup
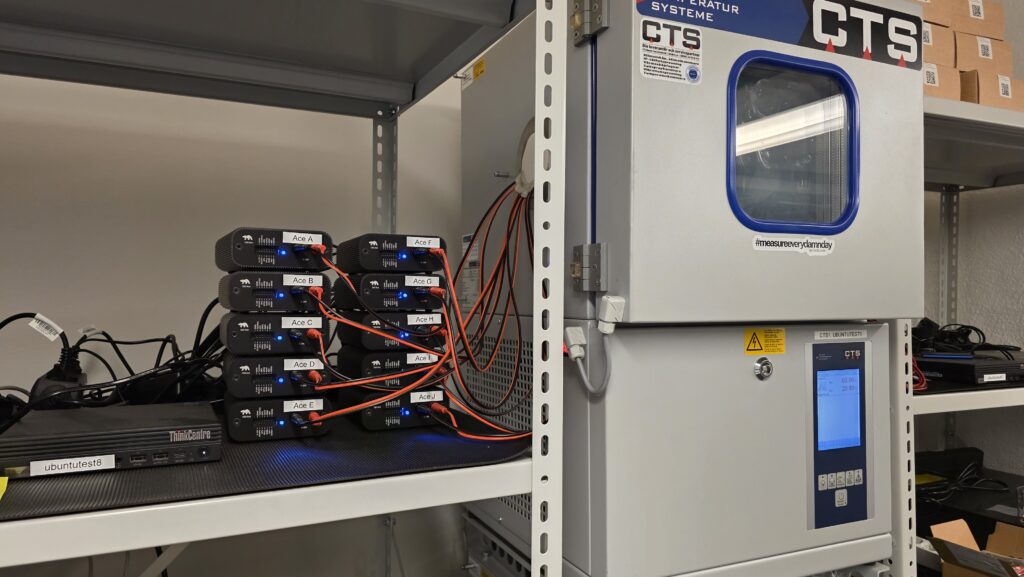
The setup was simple:
- Instrument: Otii Ace Pro units connected to a PC (it can be either Windows, macOS, or Ubuntu operating system)
- PC Software: Otii Desktop App with Otii Battery Toolbox license (Battery Validation + Battery Profiling)
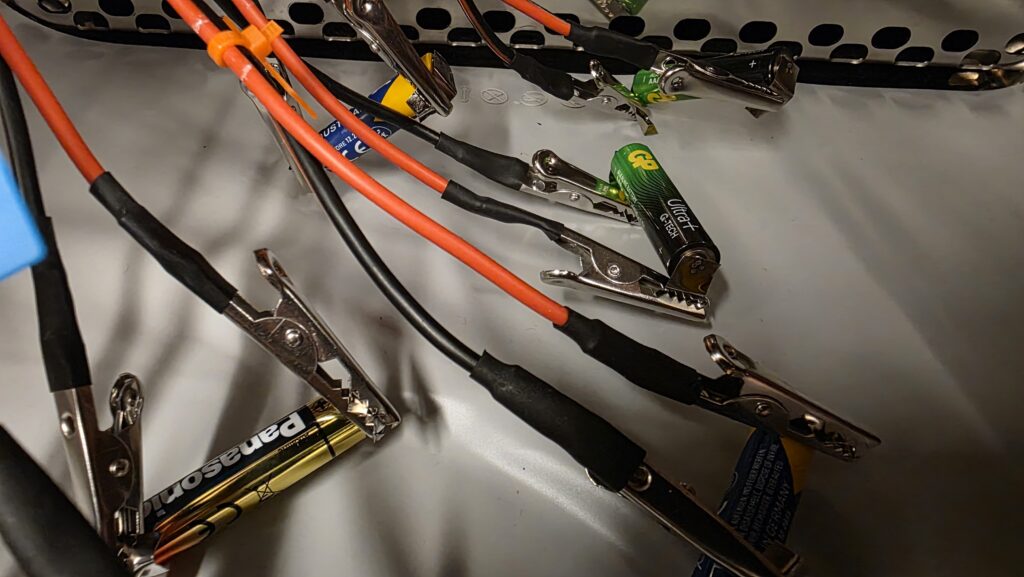
- Battery connections: Batteries spot-welded to metal strips (to reduce resistance), no holders used
Otii in action
- Battery Validation was used for constant-current and constant-power discharges. It allows fully customizable discharge patterns, including complex pulse trains or even cycling tests for rechargeable batteries.
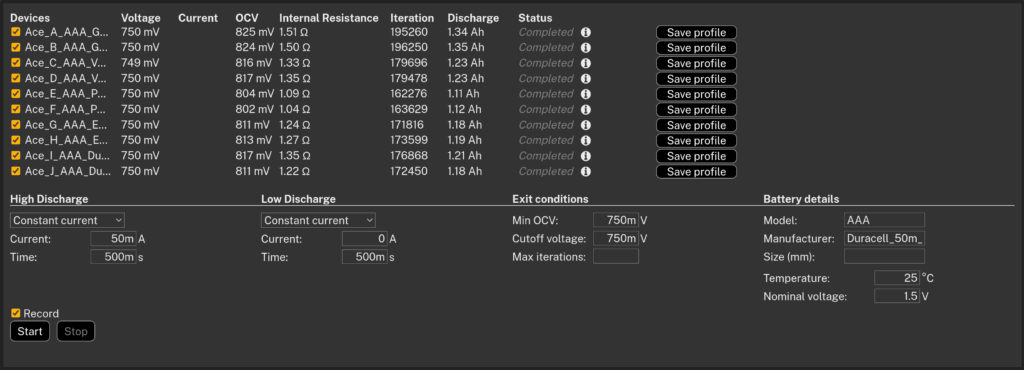
- Battery Profiling was used for pulsed discharges. It alternates between high and low loads, calculating internal resistance and open-circuit voltage during the test. Results are stored in a battery profile file that can later be used for analysis or even for battery emulation.
Discharge was stopped at 0.75 V, a typical cutoff voltage for alkaline batteries. With capacities around 1100–1400 mAh, each test ran for 40–60 hours.
The results
The measured capacities (average of two batteries per case) are shown below:
| Manufacturer | Constant Current 25mA | Constant Power 37.5mW | Pulsed 1 (30/20mA) | Pulsed 2 (50/0mA) |
|---|---|---|---|---|
| GP | 1.358 mAh | 1.234 mAh | 1.351 mAh | 1.344 mAh |
| Varta | 1.240 mAh | 1.158 mAh | 1.245 mAh | 1.232 mAh |
| Panasonic | 1.106 mAh | 1.045 mAh | 1.110 mAh | 1.118 mAh |
| Energizer | 1.179 mAh | 1.137 mAh | 1.211 mAh | 1.185 mAh |
| Duracell | 1.211 mAh | 1.144 mAh | 1.199 mAh | 1.198 mAh |
Constant current vs constant power
As expected, constant power was tougher on all batteries, since current rises as voltage falls. Capacities dropped by 4–9% compared to constant current.
| Manufacturer | CP/CC Ratio (%) |
|---|---|
| GP | 91% |
| Varta | 93% |
| Panasonic | 94% |
| Energizer | 96% |
| Duracell | 94% |
Pulsed vs constant current
For IoT-like pulsed loads, results were very close to constant current. With the moderate pulses used here, capacity differences were within ±3%. Stronger pulses would likely show bigger effects.
| Manufacturer | Pulsed 1 / CC (%) | Pulsed 2 / CC (%) |
|---|---|---|
| GP | 99% | 99% |
| Varta | 100% | 99% |
| Panasonic | 100% | 101% |
| Energizer | 103% | 101% |
| Duracell | 99% | 99% |
Conclusion
Battery testing doesn’t have to be intimidating. With Otii Ace Pro and the Otii Battery Toolbox, you can quickly set up tests, create battery profiles, and validate performance under realistic conditions for the specific use case.
Instead of relying solely on datasheet curves, you can observe how your batteries perform under your device’s usage pattern. Otii simplifies the testing process, making it straightforward and repeatable. This lets you focus on improving your product’s battery life rather than struggling with complex test setups.
You want to know how to perform battery testing with Otii Product Suite? Book a demo with one of our product specialists.